Welcome to scTx by Phenomic
Single cell RNA sequencing (scRNA-seq) technologies allow us to measure gene expression at cell resolution. There is an unmet need for tools to integrate, analyze, and visualize scRNA-seq data at large scale. At Phenomic, we have developed a solution for this, called scTx (pronounced sticks), a platform that empowers experimental and computational researchers to run scRNA-seq analyses via no-code webapp and programmatic interfaces.
Run your first analysis
In this section, we'll walk you through how to run a basic analysis on our platform.
1. Select Feature
Select plot type (UMAP, Dot, Box) or analysis of interest (DGE).

2. Select Data
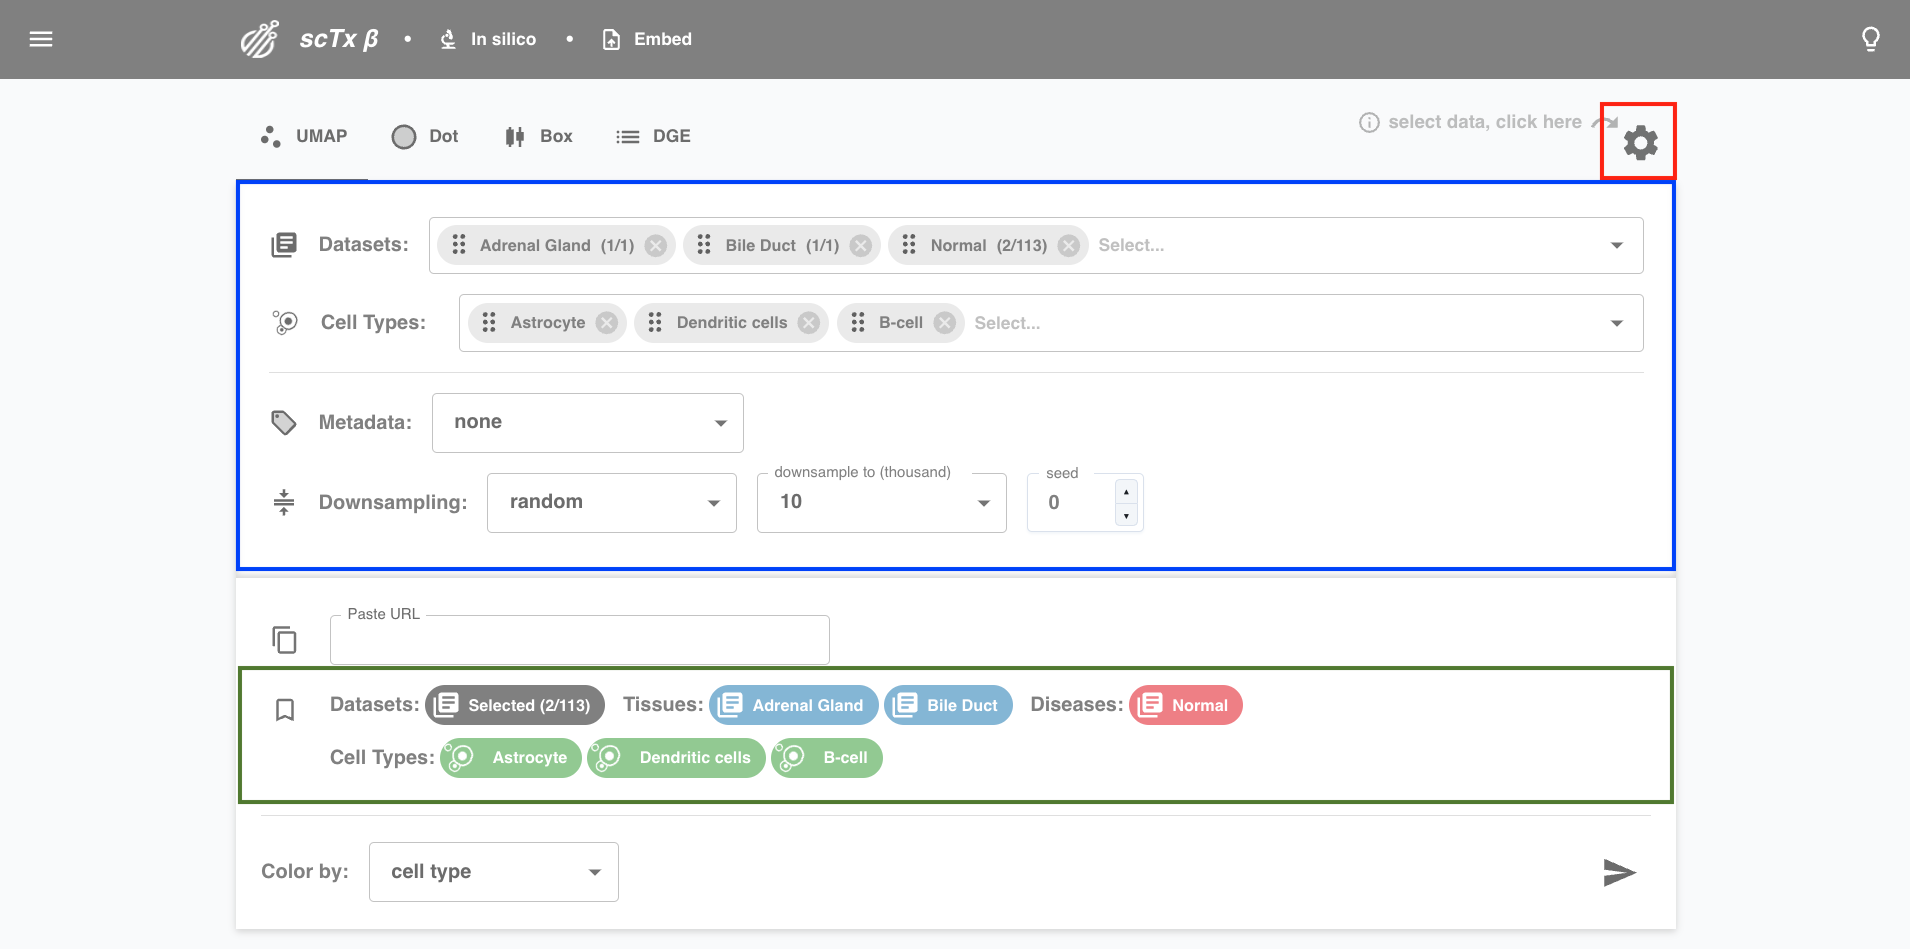
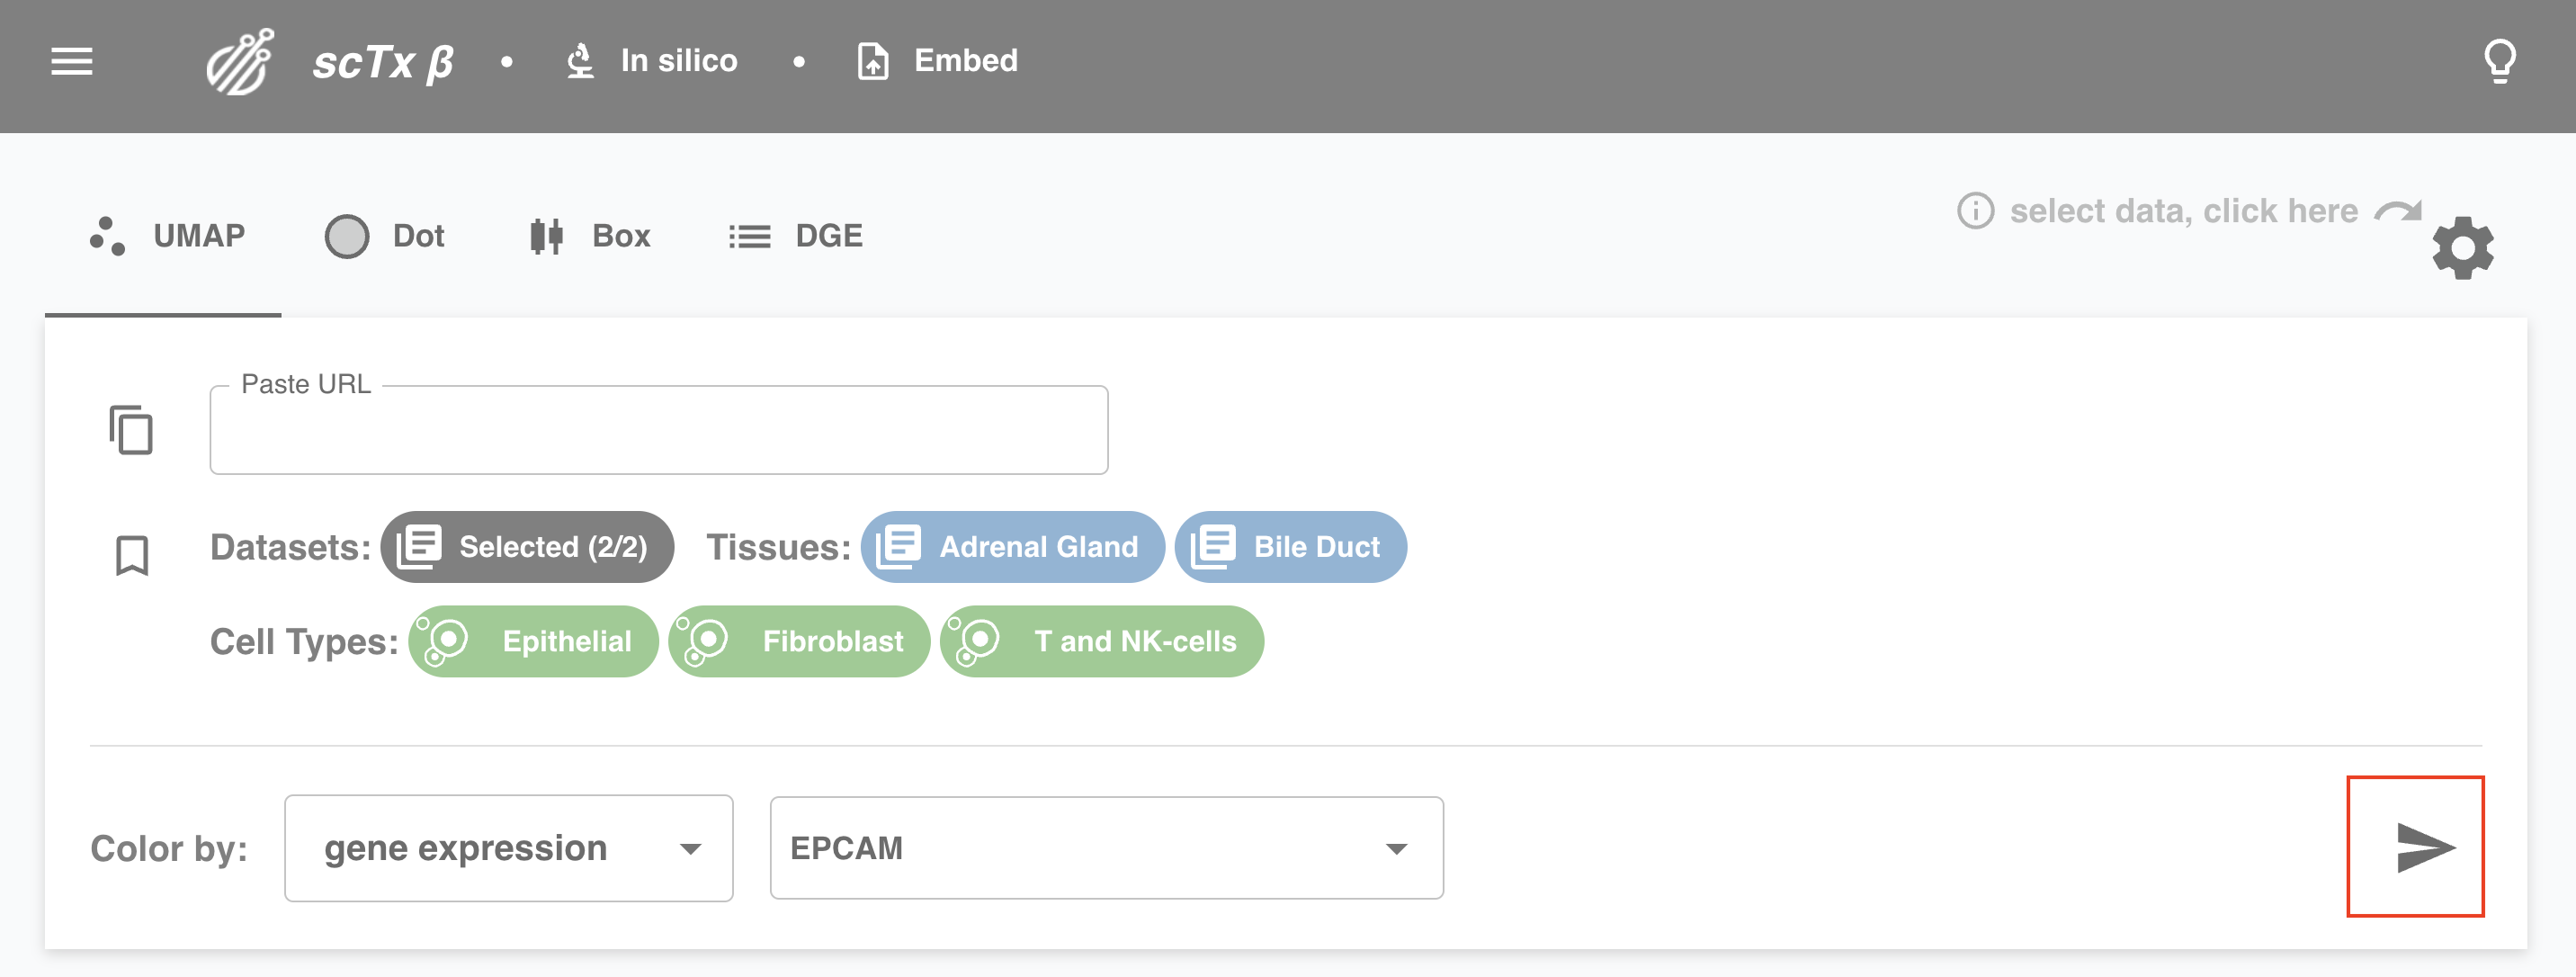
Click the settings icon to expand the data selection interface. Choose to filter on datasets, cell types, and metadata columns, and pick a downsampling for your final result. User selections will be displayed as coloured headers for reference.
3. Select Plot Specific Parameters
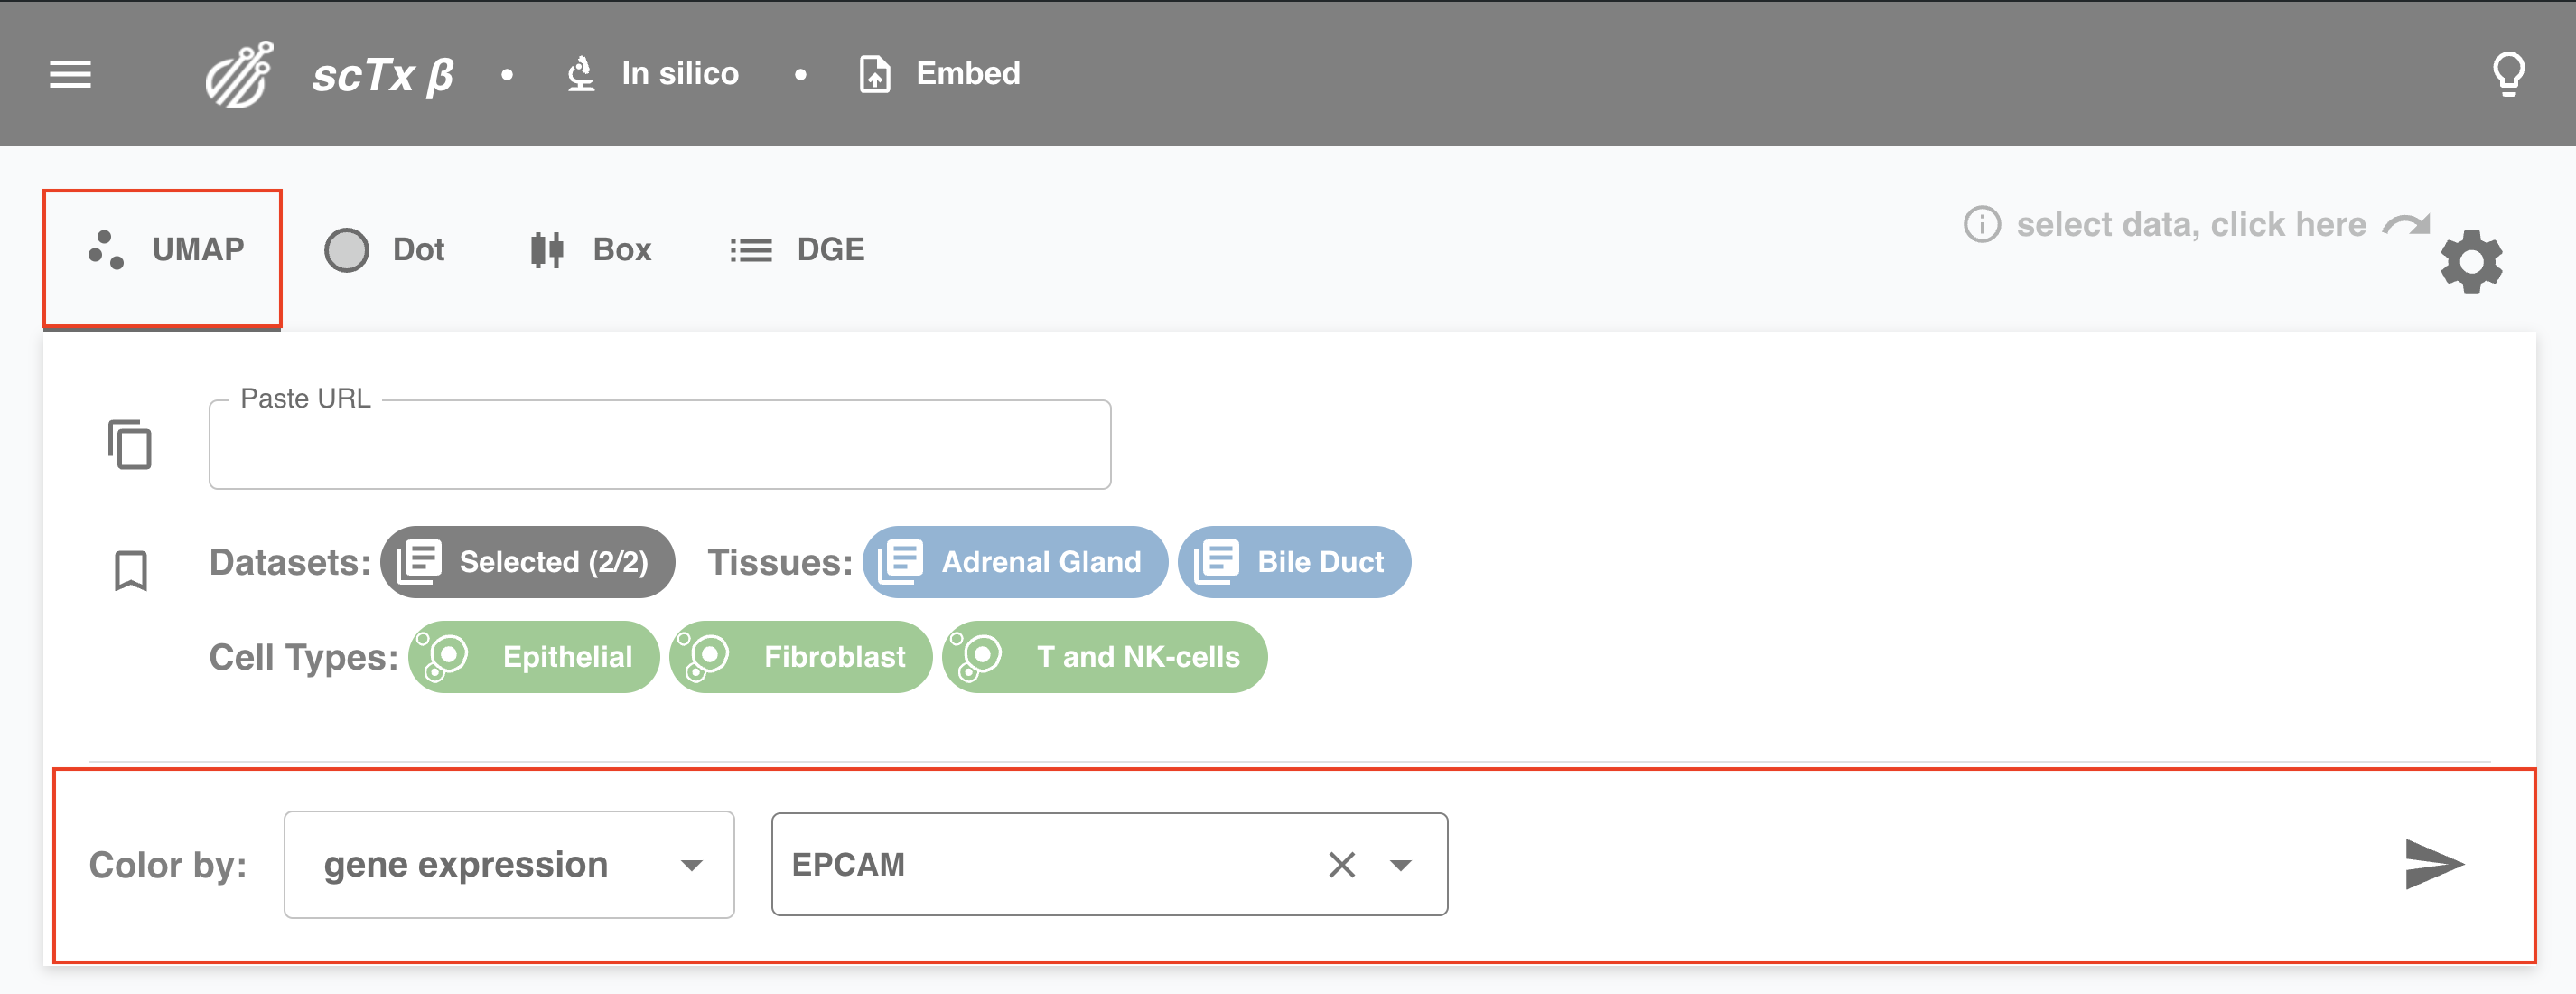
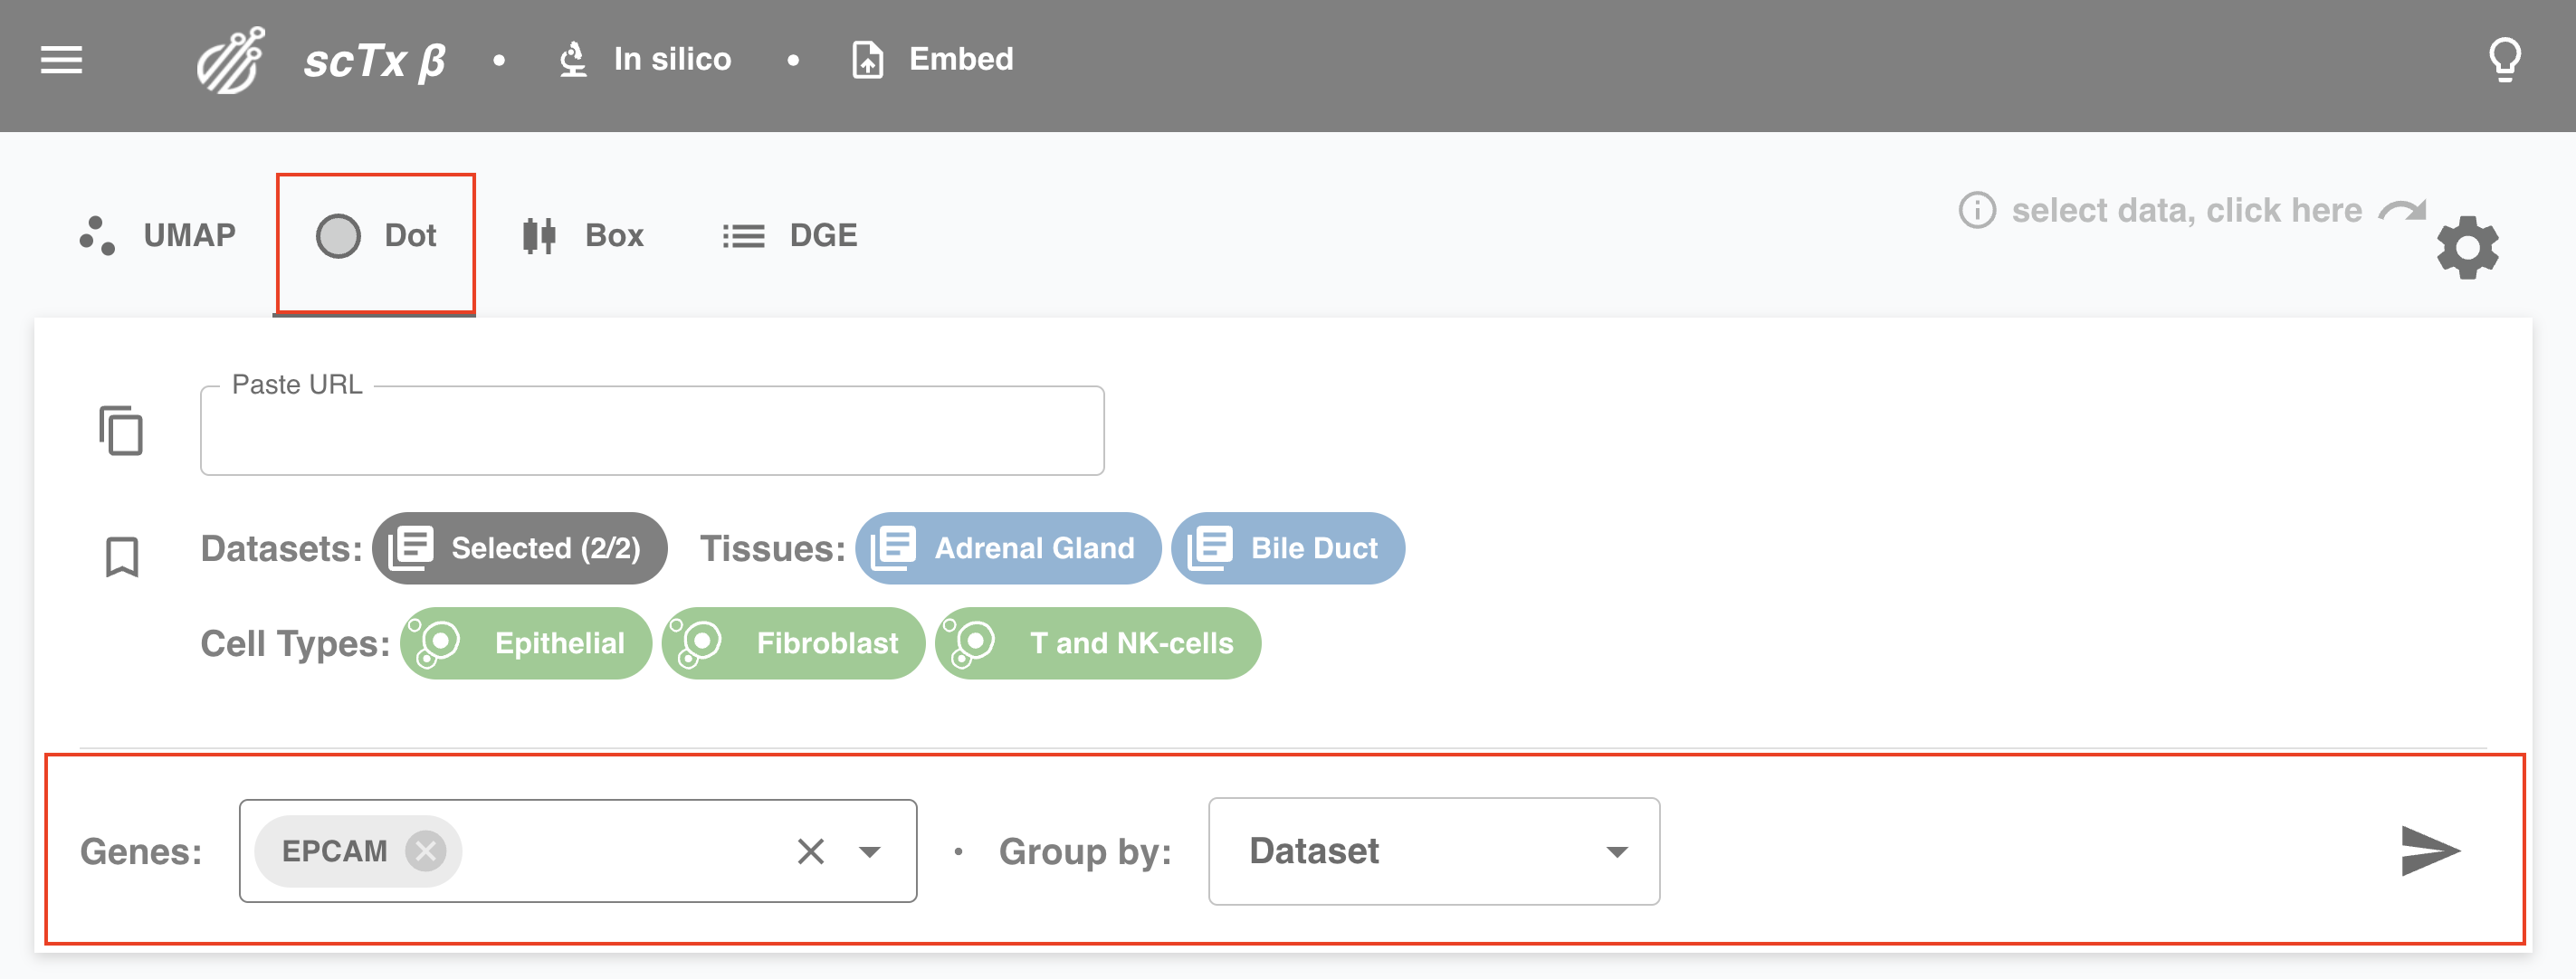
Depending on the type of plot, we might need a few more things from you. For example, for UMAP, specify a Color by option (e.g., gene expression or cell type). For dot plots, you need to specify Genes and Group by.
4. Hit Send
Click the send icon to submit the query. Wait for the results, a status report is shown in the bottom left.
5. Share Plot
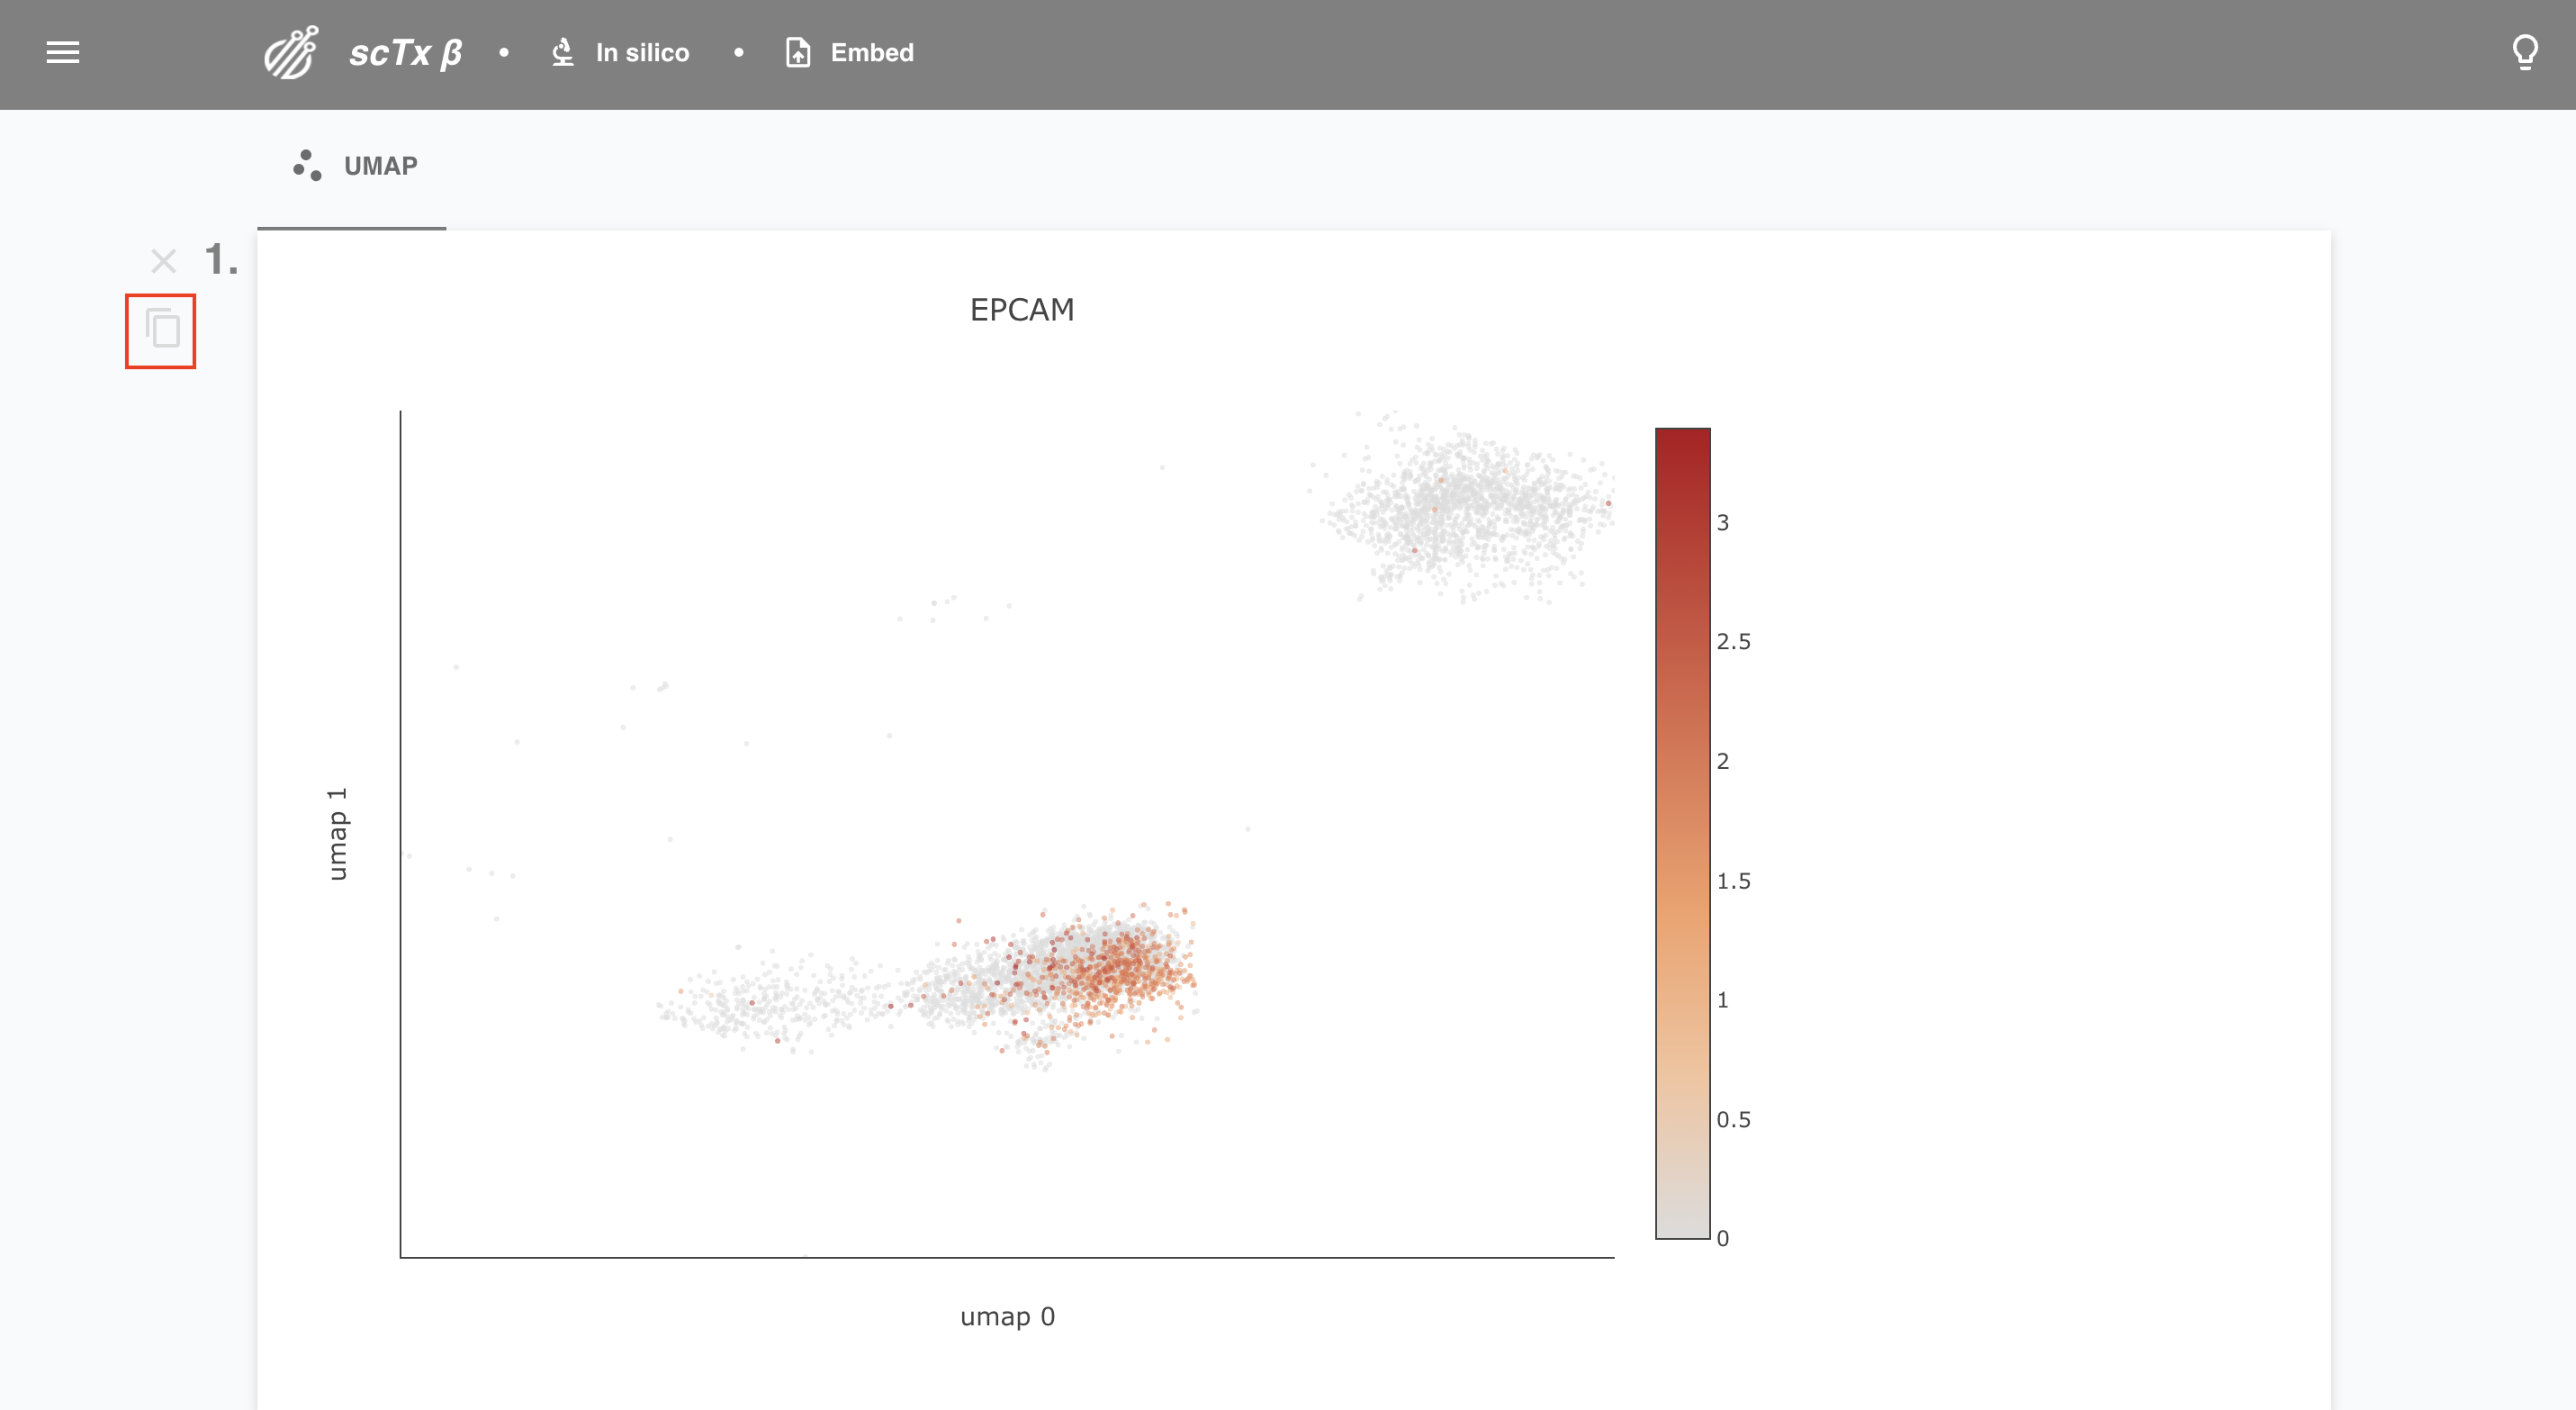
Like what you see? Click the copy button to copy a link to a plot. Feel free to paste that in your favorite browser or any of the Paste URL text boxes on the web app.
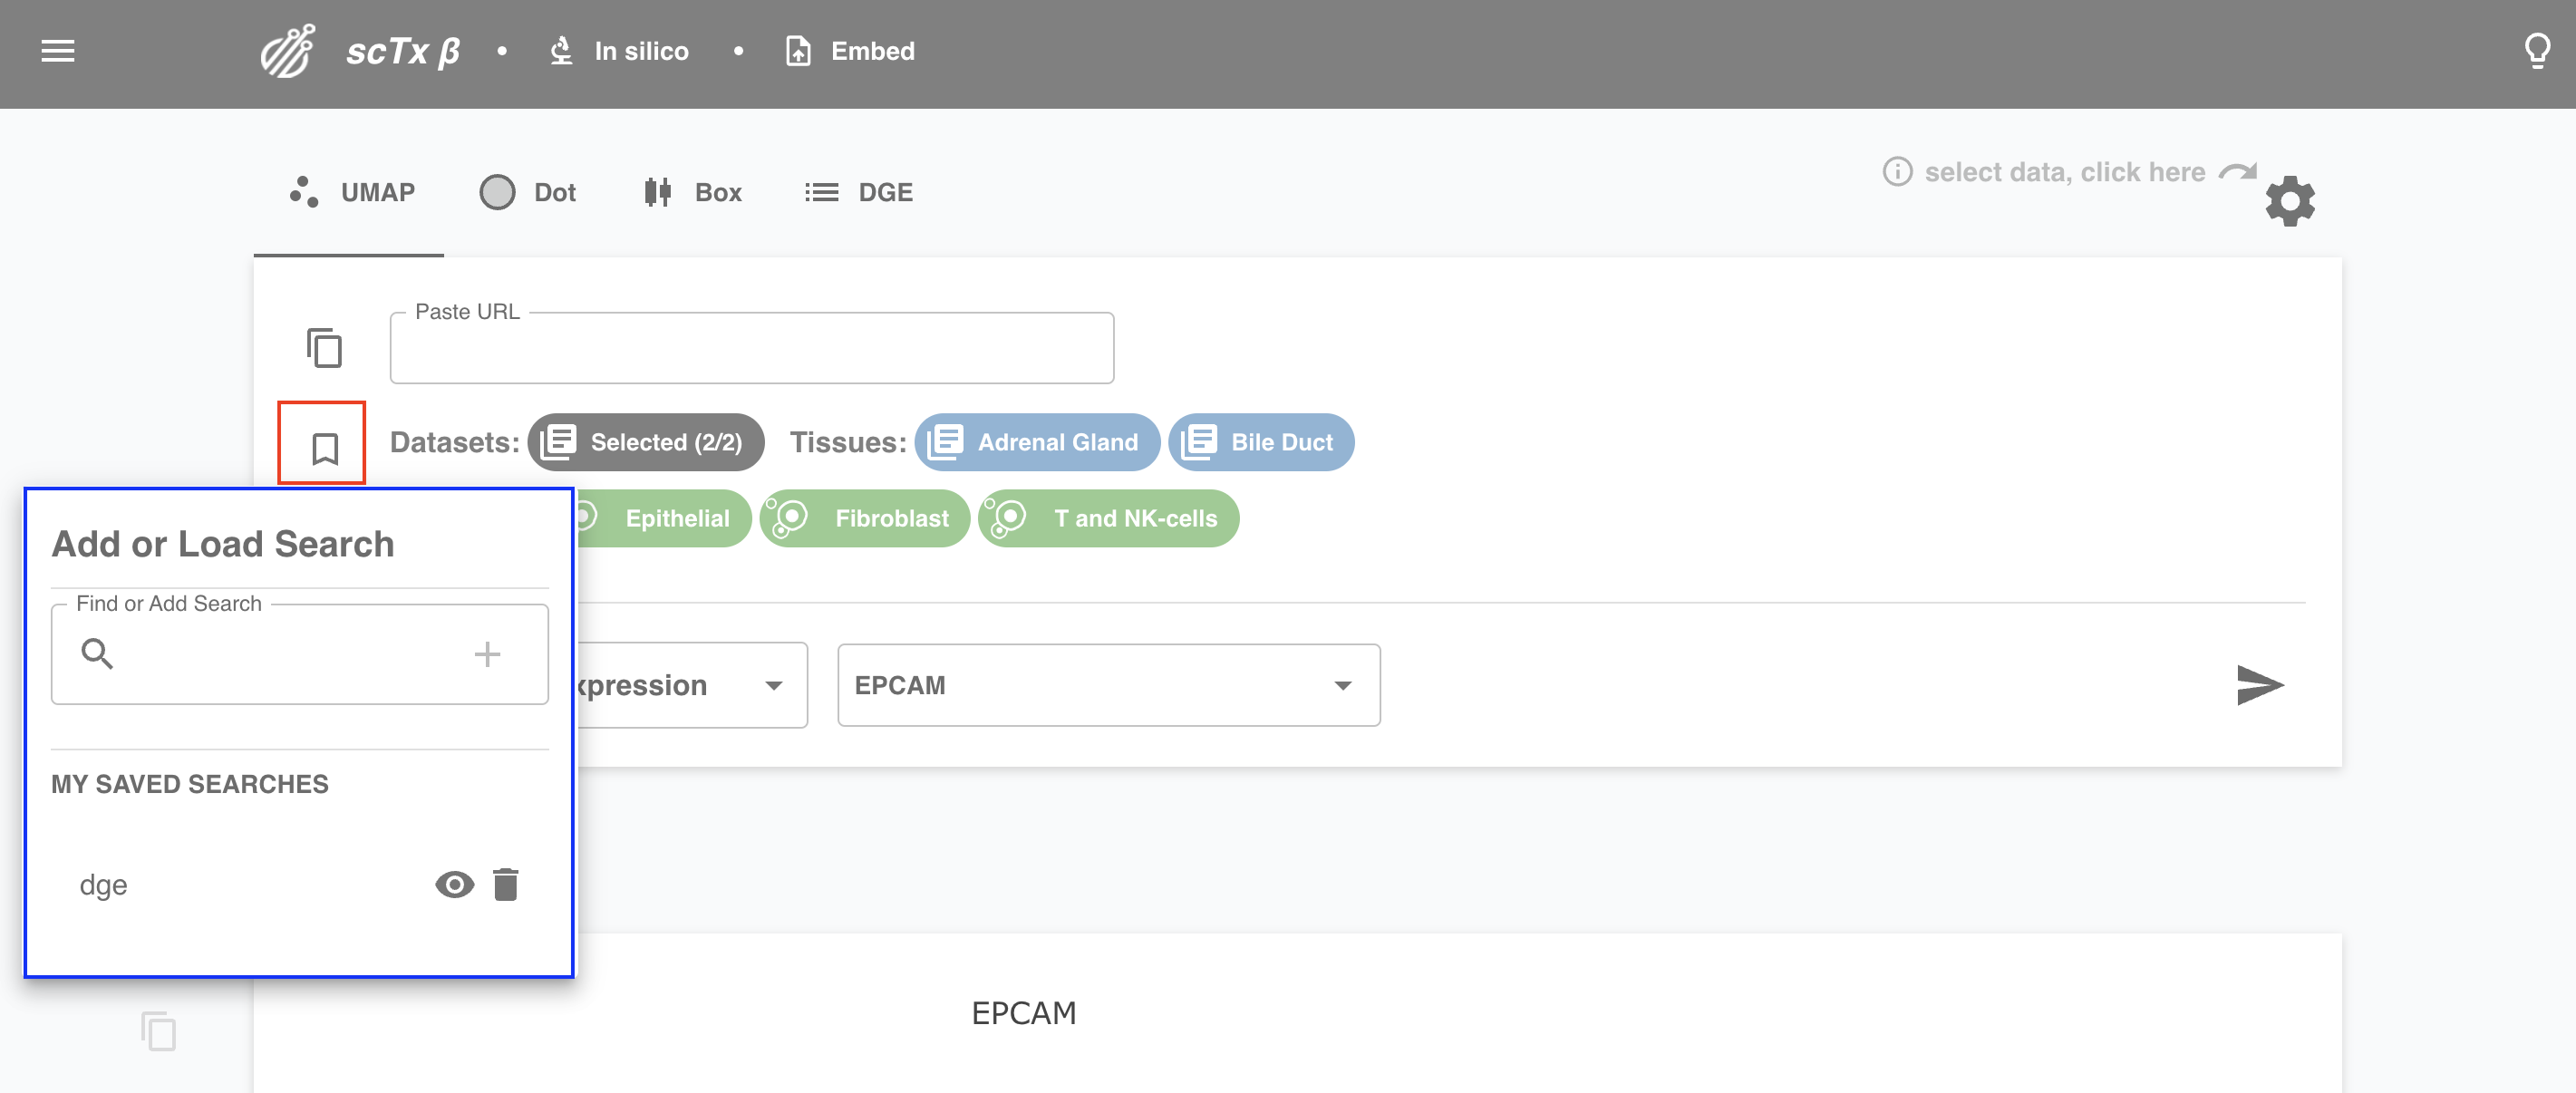
6. Bookmark your plot
You might want to keep your search for the rest of your life. Hit bookmark to save your plot! Give it a cool name, delete old bookmarks, or check out the selections underpinning new ones.
